Tokenomics Audit

Whether you’re a web3 project looking to audit your tokenomics and build community trust, a venture capital firm looking to validate token sale terms, vesting conditions, and gain a clear view of ROI scenarios or a launchpad focused on vetting quality partners.

Inflation

Supply Shocks

Risk of Dilution

Investors Balance

Valuation

Documentation

Tokenomics Audit
Tokenomics Audit
Tokenomics Audit

We analyze and optimize your tokenomics framework from every angle.

How does it work?

How does it work?

How does it work?

1

Submit Your Tokenomics

2

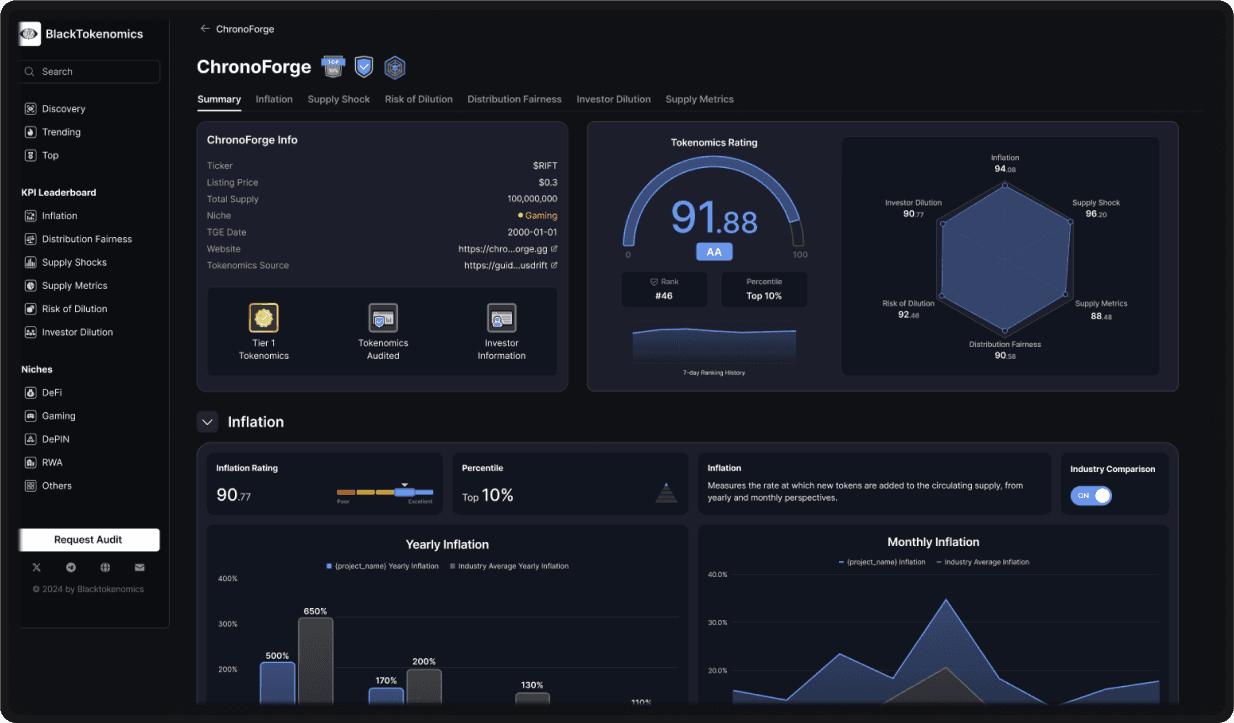
Dashboard Hexagonal Analysis

3

Rating and Optimization Areas

4

Results and Documentation

On average it takes under 72hs to get the complete results

Hexagonal Dashboard Analysis

Hexagonal Dashboard Analysis

Hexagonal Dashboard Analysis

Inflation Management

1.

Inflation

Measures the rate at which new tokens are added to the circulating supply, considering supply control mechanisms (e.g., token burns, staking incentives) that may mitigate excessive inflation. This analysis addresses how inflationary pressures might impact token value and scarcity.

2.

Supply Shocks

3.

Risk of Dilution

4.

Distribution Fairness

5.

Investors Balance

6.

Supply Metrics

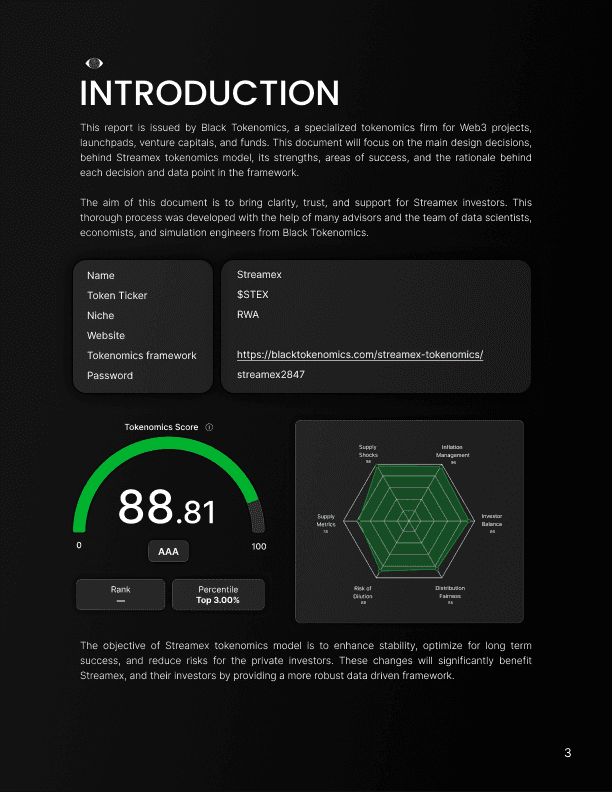
Each audit receives a score from 1 to 100, where every angle is compared to the top-performing projects within our database. The project is assigned a rank (e.g., #001) and a percentile (e.g., top 3%), offering a clear picture of how it stands relative to the best in the market.

Results Documentation

Results Documentation

Results Documentation

You’ll receive a detailed report from our tokenomics team that provides a comprehensive analysis. This report can be used effectively in investor presentations, for fundraising efforts, or to communicate the strengths of your tokenomics to the community.

  • Result 12
  • Result 11
  • Result 10
  • Result 9
  • Result 8
  • Result 7
  • Result 6
  • Result 5
  • Result 8
  • Result 7
  • Result 6
  • Result 5
  • Result 4
  • Result 3
  • Result 2
  • Result 1

Start Your Token Journey With Us

Explore More of Our Services

Tokenomics Design

Game Theory

Zero to One

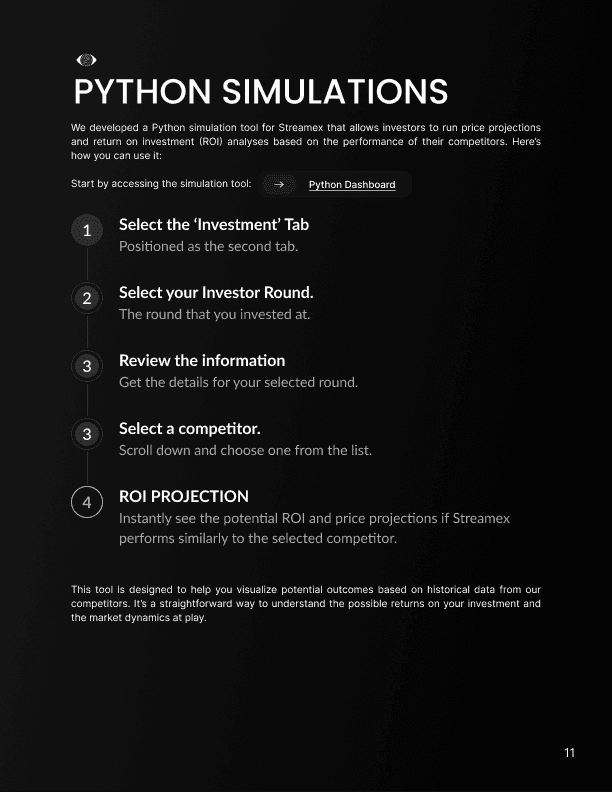
Python Simulation

Fundraising

Documentation

Audit

Incentives System

Tokenomics Fundraising

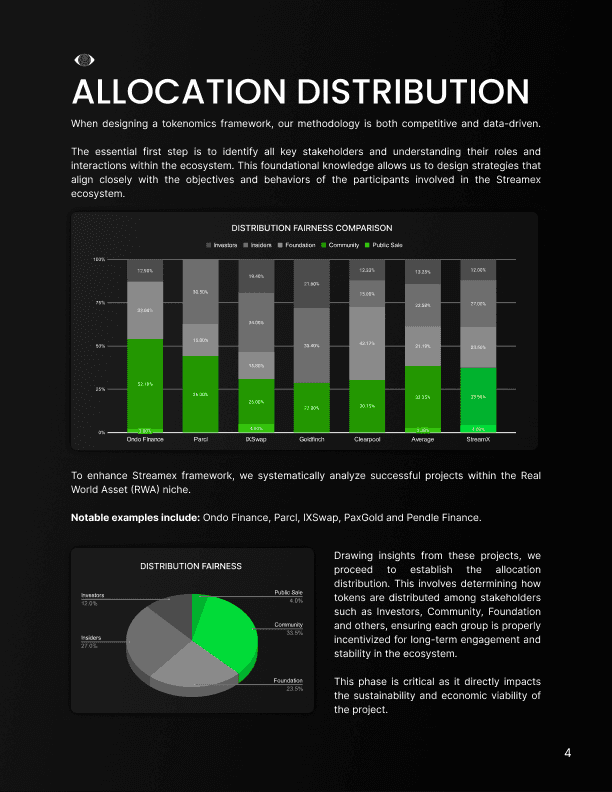
Distribution Fairness

Fundraising Setup

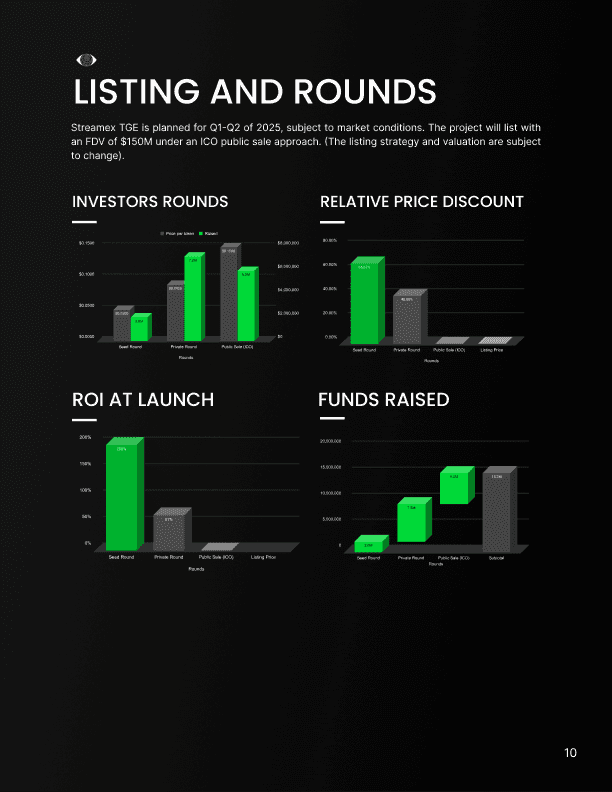
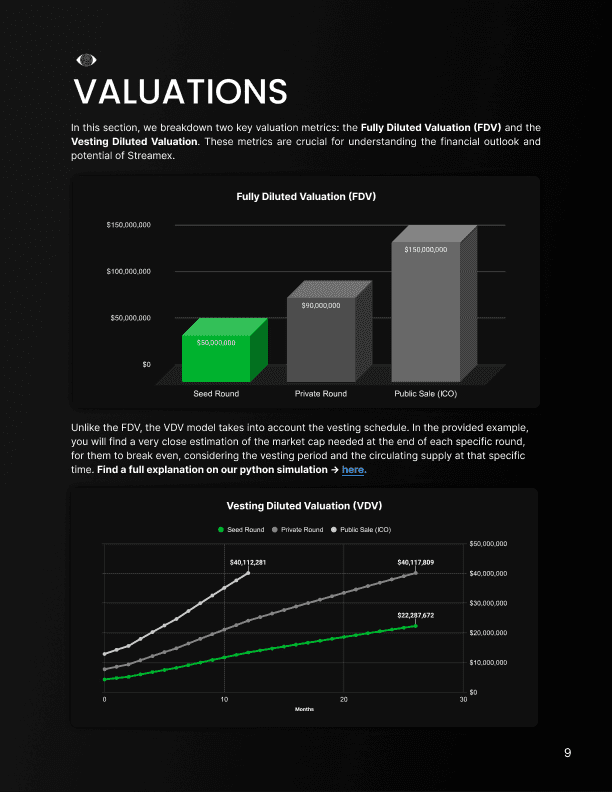
Valuation

Documentation

Investors Balance

Node System

Tiered or Fixed Price

Data-Driven

Game Theory

Node System Flow

Documentation

Dashboard